
Lifecycle: Big Data Analytics
Big Data analysis differs from traditional data analysis primarily due to the volume, velocity and variety characteristics of the data being processes. To address the distinct requirements for performing analysis on Big Data, a step-by-step methodology is needed to organize the activities and tasks involved with acquiring, processing, analyzing and repurposing data. The upcoming sections explore a specific data analytics lifecycle that organizes and manages the tasks and activities associated with the analysis of Big Data. [1] From a Big Data adoption and planning perspective, it is important that in addition to the lifecycle, consideration be made for issues of training, education, tooling and staffing of a data analytics team.
The Big Data analytics lifecycle can be divided into the following nine stages, as shown in figure 1:

Figure 1: Lifecycle of Big Data analytics
Business Case Evaluation
Each Big Data analytics lifecycle must begin with a well-defined business case that presents a clear understanding of the justification, motivation and goals of carrying out the analysis. [2] The Business Case Evaluation stage requires that a business case be created, assessed and approved prior to proceeding with the actual hands-on analysis tasks.
An evaluation of a Big Data analytics business case helps decision-makers understand the business resources that will need to be utilized and which business challenges the analysis will tackle. The further identification of KPIs during this stage can help determine assessment criteria and guidance for the evaluation of the analytic results. If KPIs are not readily available, efforts should be made to make the goals of the analysis project SMART, which stands for specific, measurable, attainable, relevant and timely.
Based on business requirements that are documented in the business case, it can be determined whether the business problems being addressed are really Big Data problems. In order to qualify as a Big Data problem, a business problem needs to be directly related to one or more of the Big Data characteristics of volume, velocity, or variety.
Data Identification
The Data Identification stage is dedicated to identifying the datasets required for the analysis project and their sources.
Identifying a wider variety of data sources may increase the probability of finding hidden patterns and correlations. For example, to provide insight, it can be beneficial to identify as many types of related data sources as possible, especially when it is unclear exactly what to look for. Depending on the business scope of the analysis project and nature of the business problems being addressed, [3] the required datasets and their sources can be internal and/or external to the enterprise.
In the case of internal datasets, a list of available datasets from internal sources, such as data marts and operational systems, are typically compiled and matched against a pre-defined dataset specification. In the case of external datasets, a list of possible third-party data providers, such as data markets and publicly available datasets, are compiled. Some forms of external data may be embedded within blogs or other types of content-based web sites, in which case they may need to be harvested via automated tools.
Data Acquisition and Filtering
During the Data Acquisition and Filtering stage, the data is gathered from all of the data sources that were identified during the previous stage. The acquired data is then subjected to automated filtering for the removal of corrupt data or data that has been deemed to have no value to the analysis objectives.
Depending on the type of data source, data may come as a collection of files, such as data purchased from a third-party data provider, or may require API integration, such as with Twitter. In many cases, especially where external, unstructured data is concerned, some or most of the acquired data may be irrelevant (noise) and can be discarded as part of the filtering process. Data classified as “corrupt” can include records with missing or nonsensical values or invalid data types. Data that is filtered out for one analysis may possibly be valuable for a different type of analysis. Therefore, it is advisable to store a verbatim copy of the original dataset before proceeding with the filtering. [4] To minimize the required storage space, the verbatim copy can be compressed.
Both internal and external data needs to be persisted once it gets generated or enters the enterprise boundary. For batch analytics, this data is persisted to disk prior to analysis. In the case of realtime analytics, the data is analyzed first and then persisted to disk.
Data Extraction
Some of the data identified as input for the analysis may arrive in a format incompatible with the Big Data solution. The need to address disparate types of data is more likely with data from external sources. The Data Extraction lifecycle stage, is dedicated to extracting disparate data and transforming it into a format that the underlying Big Data solution can use for the purpose of the data analysis.
The extent of extraction and transformation required depends on the types of analytics and capabilities of the Big Data solution. For example, extracting the required fields from delimited textual data, such as with webserver log files, may not be necessary if the underlying Big Data solution can already directly process those files.
Data Validation and Cleansing
Invalid data can skew and falsify analysis results. Unlike traditional enterprise data, where the data structure is pre-defined and data is pre-validated, data input into Big Data analyses can be unstructured without any indication of validity. Its complexity can further make it difficult to arrive at a set of suitable validation constraints.
Big Data solutions often receive redundant data across different datasets. This redundancy can be exploited to explore interconnected datasets in order to assemble validation parameters and fill in missing valid data.
Data Aggregation and Representation
Data may be spread across multiple datasets, requiring that datasets be joined together via common fields, for example date or ID. In other cases, the same data fields may appear in multiple datasets, such as date of birth. Either way, a method of data reconciliation is required or the dataset representing the correct value needs to be determined.
Performing this stage can become complicated because of differences in:
- Data Structure – Although the data format may be the same, the data model may be different.
- Semantics – A value that is labeled differently in two different datasets may mean the same thing, for example “surname” and “last name.”
Data Analysis
The Data Analysis stage is dedicated to carrying out the actual analysis task, which typically involves one or more types of analytics. This stage can be iterative in nature, especially if the data analysis is exploratory, in which case analysis is repeated until the appropriate pattern or correlation is uncovered. The exploratory analysis approach will be explained shortly, along with confirmatory analysis.
Depending on the type of analytic result required, this stage can be as simple as querying a dataset to compute an aggregation for comparison. On the other hand, it can be as challenging as combining data mining and complex statistical analysis techniques to discover patterns and anomalies or to generate a statistical or mathematical model to depict relationships between variables.
Data Visualization
The ability to analyze massive amounts of data and find useful insights carries little value if the only ones that can interpret the results are the analysts.
Business users need to be able to understand the results in order to obtain value from the analysis and subsequently have the ability to provide feedback, as indicated by the dashed line leading from stage 8 back to stage 7. The results of completing the Data Visualization stage provide users with the ability to perform visual analysis, allowing for the discovery of answers to questions that users have not yet even formulated. Visual analysis techniques are covered later in this book.
Utilization of Analysis Results
Subsequent to analysis results being made available to business users to support business decision-making, such as via dashboards, there may be further opportunities to utilize the analysis results. The Utilization of Analysis Results stage, is dedicated to determining how and where processed analysis data can be further leveraged.
Depending on the nature of the analysis problems being addressed, it is possible for the analysis results to produce “models” that encapsulate new insights and understandings about the nature of the patterns and relationships that exist within the data that was analyzed. A model may look like a mathematical equation or a set of rules. Models can be used to improve business process logic and application system logic, and they can form the basis of a new system or software program.
References:
- https://www.informit.com/articles/article.aspx?p=2473128&seqNum=11
- https://www.tutorialspoint.com/big_data_analytics/big_data_analytics_lifecycle.htm
- https://energie.labs.fhv.at/~repe/bigdata/introduction-to-big-data-projects/data-analytics-lifecycle/
- https://online.hbs.edu/blog/post/data-life-cycle
Cite this article:
D. Vinotha (2021), Lifecycle: Big Data Analytics pp. 6
Recent Post
-

Data Science in Modern Agriculture
Agriculture is the backbone of the world economy, but the industry currently needs more support than any other...
-

Security Trends in Data Centers in 2021
Data center security is an ongoing challenge for virtually every modern organization.
-

Database Architecture
A Database Architecture is a representation of DBMS design. It helps to design, develop, implement, and maintain the database management system.
-
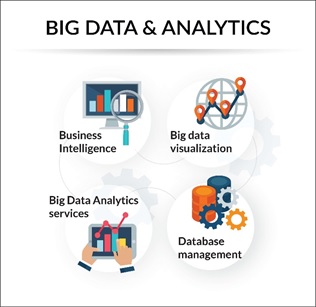
Big Data Analytics
Big data analytics is the use of advanced analytic techniques against very large, diverse data sets that include structured
-
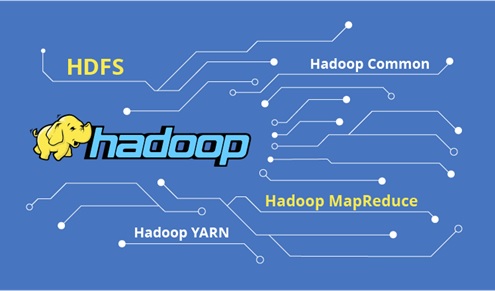
Hadoop
Apache Hadoop is an open source framework that is used to efficiently store and process large datasets ranging in size from gigabytes to petabytes of data.
-
Lifecycle: Big Data Analytics
Big Data analysis differs from traditional data analysis primarily due to the volume, velocity and variety characteristics of the data being processes.
-
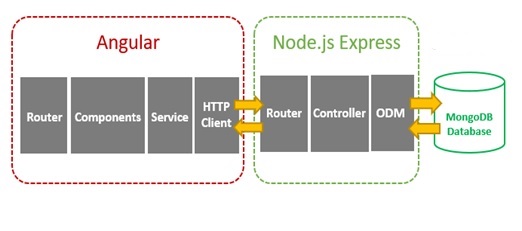
Angular vs Node JS
Angular is a platform for developing single-page applications with the use of TypeScript and HTML....
-
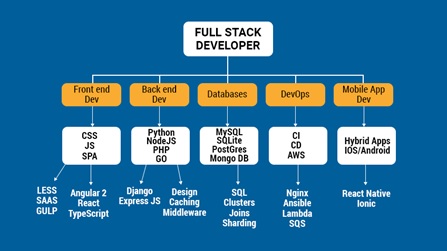
Full Stack Development
Full stack development: It refers to the development of both front end (client side) and back end (server side) portions of web application...
-
Methods of Natural Language Processing
Natural language processing strives to build machines that understand and respond to text or voice data...
-

A Deep Study of Data science
Data science is a deep study of the massive amount of data, which involves extracting meaningful insights from raw...
-

Benefits of Data visualization
Data visualization is the graphical representation...
-
The Process of Data Mining
Data mining is more than just extracting or mining data...
-
Benefits of Naive Bayes
Naive Bayes falls under the umbrella of supervised machine learning algorithms that are primarily used for classification...
-

Functions Of Data Warehouse Modernization
We’re living in times where big data and analytics are driving all business decisions and traditional...
-
Techniques Of Dimensionality Reduction Method
The number of input features, variables, or columns present in a given...