
Data Discovery/Visualization
Data discovery has increased its impact in the last year. A survey conducted by the Business Application Research Center listed data discovery in the top 2 business intelligence trends by the importance hierarchy. BI practitioners steadily show that the empowerment of business users is a strong and consistent trend. Since humans process visual data better, the data discovery trend will find increment as one of the most important BI trends in 2021.[1]

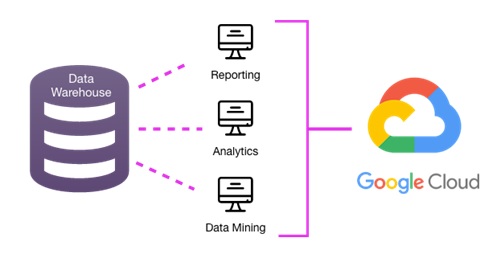
Figure 1. the data discovery / Visualization
Figure 1 shows The three main categories of visual data discovery include data preparation, data visualization, and advanced analytics and reporting:
- Data Preparation: This preprocessing step uses statistical techniques to merge unstructured, raw data from disparate sources, then clean, transform, and eliminate noise from the data so that quality is consistent and formatting is usable.
- Data Visualization: The human brain instantly recognizes patterns and relationships in visualizations. Data visualization is a critical process for analyzing big data, in which important insights and messages would otherwise be lost, and for displaying the results of machine learning and predictive analytics.
- Advanced Analytics and Reporting: Descriptive statistics organizes, summarizes, and breaks down data into a simple, intelligible report that is easy to understand and helps businesses make data-driven decisions.[2]
Tools to support the data discovery process
There are several software solutions that support one or all of the aforementioned steps of the data discovery process. Most tools support more than one category.
The following overview of tools for data preparation, visual analysis and guided advanced analytics reflects the main focus of the software and not its full functional spectrum.
However, all of the data discovery tools have the following characteristics in common:
- They target business users and provide a code-free environment for data discovery.
- They support access to a good set of data sources.
- They often provide data preparation and modeling capabilities such as join data from different sources.
- They often support visual and easy-to-digest representations of data.
- They often allow interactive navigation within visualizations.
- Some of them provide out-of-the-box guided advanced analytics features to support statistical analyses.
- They offer options for sharing insights with other colleagues.
- Seamless integration of data preparation, analysis and analytics.[3]
Data Visualization Features & Capabilities
- Pre-built visualization formats (heatmaps, scatter plots, etc.)
- Location analytics / geographic visualization
- Predictive analytics
- Support for machine-learning models
- Pattern recognition and data mining
- Integration with R or other statistical packages
Data Discovery & Data Visualization
Data visualization capabilities are often found alongside data discovery capabilities. However, more specialized tools have also emerged to serve each distinct use case. Data discovery tools focus more on centralizing data accessibility across disparate sources. In contrast, visualization tools focus on the actual graphical analysis of said data. Business Intelligence platforms that emphasize self-serviceability unify the entire pipeline for organization-wide visibility into data and actionable business intelligence. [4]
References:
- https://www.datapine.com/blog/business-intelligence-trends/
- https://www.omnisci.com/technical-glossary/data-discovery
- https://bi-survey.com/data-discovery
- https://www.trustradius.com/data-visualization-bi
Cite this article:
Thanusri swetha J (2021), Data Discovery/Visualization, Anatechmaz, pp. 27
Recent Post
-

Augmented Analytics in Data Science
Augmented analytics is the use of enabling technologies such as machine learning and AI to assist...
-
Automatic Identification and Data Capture (AIDC)
Data discovery has increased its impact in the last year. A survey conducted by the Business Application...
-
Automatic Identification of Data Collection
Automatic identification and data collection (also called AIDC, Auto ID, automatic data capture...
-
Characteristics of Data Lake
A data lake is a storage repository that holds a vast amount of raw data in its native format until it is needed for analytics...
-
Data Quality Management (DQM)
Data is the driving force of every organization in the modern world. As organizations continue to collect more...
-
Embedded Analytics
When data analytics occurs within a user’s natural workflow, embedded analytics is the name of the game...
-

Graph Analytics in Data Science
Graph Data Science is a science-driven approach to gain knowledge from the relationships and structures in data...
-
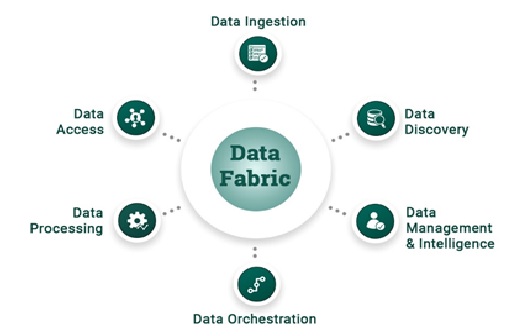
The Capabilities of Data Fabric
Gartner defines data fabric as a design concept that serves as an integrated layer (fabric) of data and connecting processes...
-
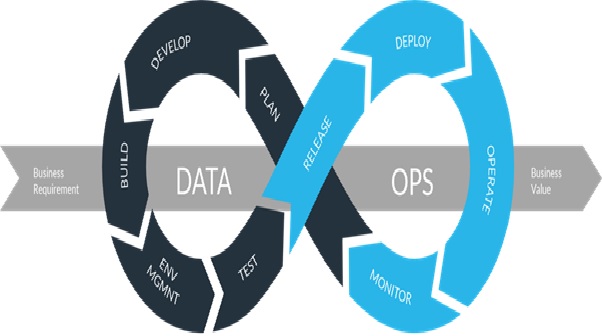
The Future of DataOps
DataOps (data operations) is an agile, process-oriented methodology for developing and delivering analytics...
-

The Future of Encryption
Data encryption is the process by which digital data is translated into a complex code using encryption algorithms...
-
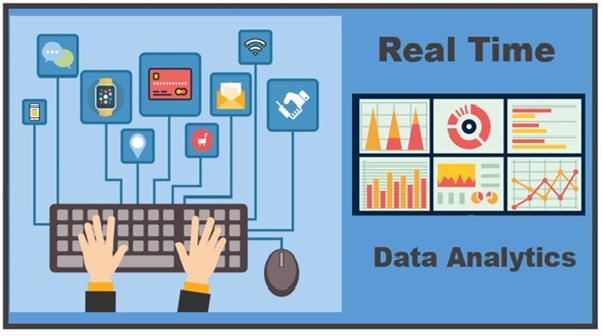
The Real Time Data Analytics
Streaming data or real-time data is dynamic data that is continuously generated from a variety of sources like sensors...
-
Data Discovery/Visualization
Data discovery has increased its impact in the last year. A survey conducted by the Business Application Research Center...
-
Benefits and Stages of Data Warehouse Modernization
Data warehousing is a technology that aggregates structured data from one or more sources...
-
Data Governance Tools (DG)
Data governance (DG) is the process of managing the availability, usability, integrity and security of the data in enterprise systems...
-
The Basic of Data Wrapper
Patterns and frameworks form an integral component of software engineering. A wrapper pattern is a class with a special interface...