
Graph Analytics in Data Science
Graph Data Science is a science-driven approach to gain knowledge from the relationships and structures in data, typically to power predictions. It describes a toolbox of techniques that help data scientists answer questions and explain outcomes using graph data.[1]

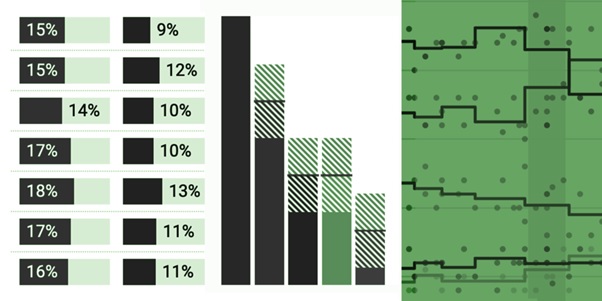
Figure 1. The graph analytics in data science
Figure 1 shows Graph analytics is a relatively new area for analytics which refers to analysis applied on graph-based data. Graph analytics (also called network analysis) as its name suggests is an analysis based amongst entities or graph nodes which could be products or customers or operations or even devices.[2]
Types of Graphs.
1. Path Analysis: Examines the relation between nodes in a graph. In other words, it determines the shortest distance between two nodes.
2. Connectivity Analysis: It helps in comparing connectivity across networks by outlining how strongly or weakly two nodes are connected. This helps to determine how many edges are flowing into a node and how many are flowing out of the node.
3. Centrality Analysis: It enables estimation of how important a node is for the connectivity of the network. It determines the most influential people in a social network through ranking or finds out the most highly accessed web pages.
4. Community Analysis: This is a distance and density-based analysis of relationships used in groups of people, to find groups of people frequently interacting with each other in a social network. It also identifies whether individuals are transient and can predict if the network will grow.[4]
Applications of Graph Algorithms or Graph Analytics:
Graph Algorithms or Graph Analytics are used in a number of applications
- Clustering - the grouping of objects based on their characteristics such that there is high intra- cluster similarity and low inter-cluster similarity. Applications include machine learning, data mining, statistics, image processing, and numerous physical and social science applications.
- Cutting or Partitioning – To find the cut with the fewest number of crossing edges. Applications include finding weak spots in data and communications networks, and community detection in social networks.
- Search – Breadth first search and Depth first search.
- Shortest path – To find the shortest path between two nodes of interest. Applications include social network analysis, transportation logistics and many other optimization problems.
- Widest path – To find a path between two designated vertices in a weighted graph, maximizing the weight of the minimum-weight edge in the path. Applications include IP traffic routing and traffic-sensitive path planning.
- Connected components – A strongly connected graph is one where you can get to every node in the graph from any starting node. The strongly connected components are the maximal sub- regions of a graph for which each sub-region is strongly connected. Applications include social network analysis.
- Page Rank – Is a measure of popularity of webpages and is used by internet search for ranking them. Applications also include social network analysis, recommendation systems, and for novel uses in natural science when studying the relationship between proteins and in ecological networks.[3]
References:
- https://neo4j.com/developer/graph-data-science/
- https://medium.com/swlh/what-is-graph-analytics-9223d71c26d8
- https://developer.nvidia.com/discover/graph-analytics
- https://www.analyticsinsight.net/graph-analytics-important/
Cite this article:
Thanusri swetha J (2021), Graph Analytics in Data Science, Anatechmaz, pp. 22
Recent Post
-

Augmented Analytics in Data Science
Augmented analytics is the use of enabling technologies such as machine learning and AI to assist...
-
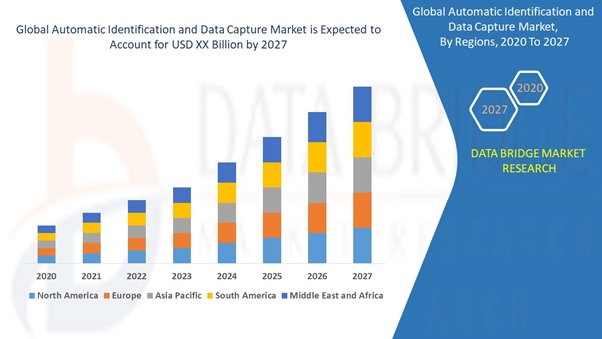
Automatic Identification and Data Capture (AIDC)
Data discovery has increased its impact in the last year. A survey conducted by the Business Application...
-
Automatic Identification of Data Collection
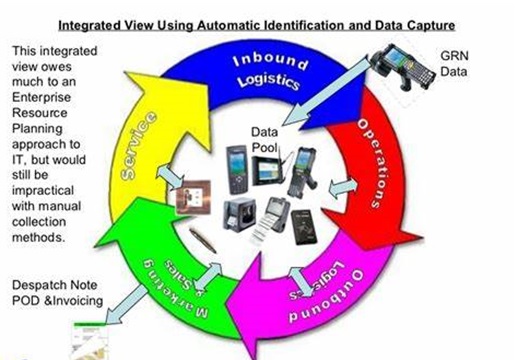
Automatic identification and data collection (also called AIDC, Auto ID, automatic data capture...
-
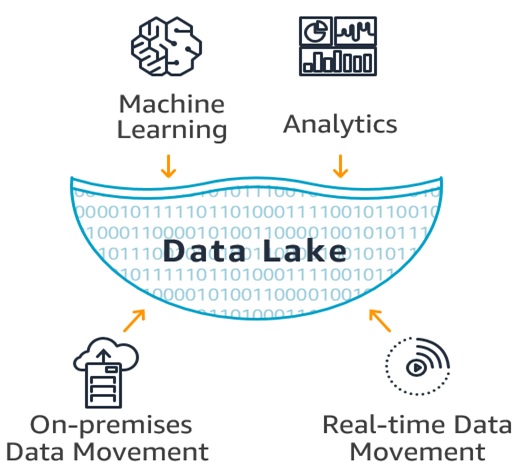
Characteristics of Data Lake
A data lake is a storage repository that holds a vast amount of raw data in its native format until it is needed for analytics...
-
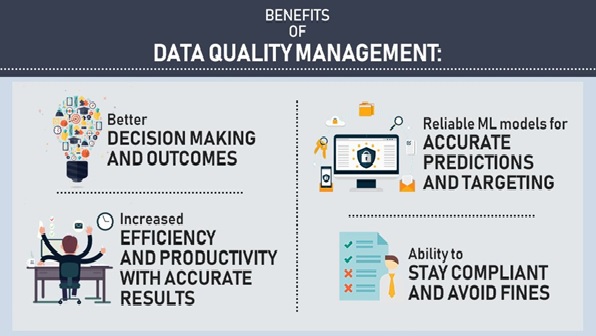
Data Quality Management (DQM)
Data is the driving force of every organization in the modern world. As organizations continue to collect more...
-

Embedded Analytics
When data analytics occurs within a user’s natural workflow, embedded analytics is the name of the game...
-
Graph Analytics in Data Science
Graph Data Science is a science-driven approach to gain knowledge from the relationships and structures in data...
-
The Capabilities of Data Fabric
Gartner defines data fabric as a design concept that serves as an integrated layer (fabric) of data and connecting processes...
-
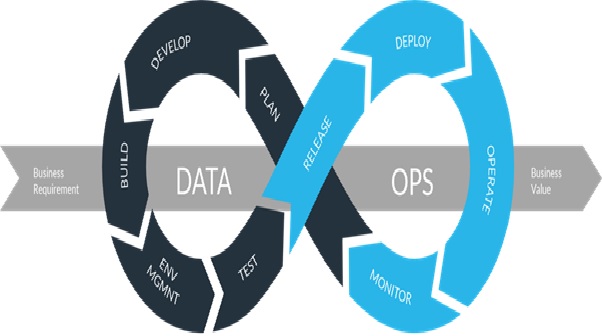
The Future of DataOps
DataOps (data operations) is an agile, process-oriented methodology for developing and delivering analytics...
-

The Future of Encryption
Data encryption is the process by which digital data is translated into a complex code using encryption algorithms...
-

The Real Time Data Analytics
Streaming data or real-time data is dynamic data that is continuously generated from a variety of sources like sensors...
-

Data Discovery/Visualization
Data discovery has increased its impact in the last year. A survey conducted by the Business Application Research Center...
-
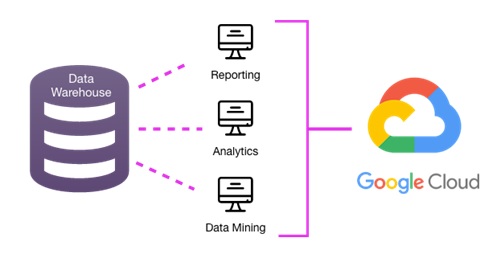
Benefits and Stages of Data Warehouse Modernization
Data warehousing is a technology that aggregates structured data from one or more sources...
-
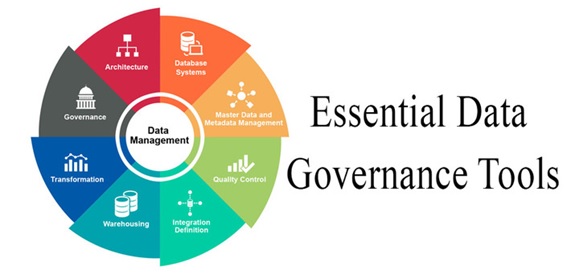
Data Governance Tools (DG)
Data governance (DG) is the process of managing the availability, usability, integrity and security of the data in enterprise systems...
-
The Basic of Data Wrapper
Patterns and frameworks form an integral component of software engineering. A wrapper pattern is a class with a special interface...