
Augmented Analytics in Data Science
Augmented analytics is the use of enabling technologies such as machine learning and AI to assist with data preparation, insight generation and insight explanation to augment how people explore and analyze data in analytics and BI platforms. It also augments the expert and citizen data scientists by automating many aspects of data science, machine learning, and AI model development, management and deployment.[1]

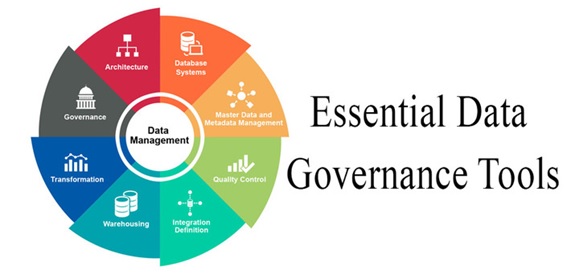
Figure 1. the augumented analytics in data science
Augment analytics is a term that was originally created by the research firm Gartner in 2017. They claimed that it would be the “future of data analytics” and it sure looks like it! Augmented analytics basically uses Machine Learning and Artificial Intelligence to enhance data analytics by finding a new method of creating, developing, and sharing data analytics. The usage of augmented analytics in the industry means that companies can automate many analytics capabilities such as the creation, analysis, and building of data models. Augmented analytics also ensures that it is much easier to interact with and explain the data insights generated which help in data exploration and analysis.[3]
Top 4 benefits of augmented analytics
Having AI and machine-based analytics aren't just talking points, but a major benefit.
Augmented analytics and its forms are becoming tightly intertwined with the end-to-end analytics process, and brings numerous advantages for software vendors and enterprises. It’s vital to understand how it helps users in all stages of analysis.
#1 – Immediate automated analysis: The heavy lifting of manually sifting through huge volumes of complex data (due to lack of skills or time constraints) is significantly reduced as analysis is automated and can be set to always run. If your augmented tool finds a spike or drop or change, it can also automate the delivery of that insight, ensuring that users can then act immediately.
#2 – Faster data preparation: Augmented data preparation brings data together from multiple sources much faster. Algorithms can be used to detect schemas and joins, repetitive transformation and integrations can be fully automated, data quality and enrichment recommendations are auto-generated by the system, and you can even automate the profiling, tagging and annotation of your data before you start data preparation – and clean it for reliable analysis in a fraction of the time it takes manually.
#3 – Improved data literacy: With natural language assisting in the explanation of discoveries and providing automated analysis of results, your users can improve their data literacy. This can assist in fostering a data-led culture that benefits the organization as a whole for the long-term.
#4 – Reduced analytical bias: Enabling the machine to perform analysis can assist in reducing analytical bias. If you don’t know what you’re looking for, you make assumptions trying to find it. Often those assumptions could lead to the use of specific data to support it. Augmented analytics can minimize potential bias often performing analysis across a wider breadth and depth of data, looking purely at factors of statistical significance. However, be aware that bias can impact the machine.[2]
A combination of data science and artificial intelligence, augmented analytics makes data analytics accessible for more people to get value from data, allowing them to ask questions and automatically generate insights in an easy, conversational manner.[4]
References:
- https://www.gartner.com/en/information-technology/glossary/augmented-analytics
- https://www.yellowfinbi.com/blog/2020/10/what-is-augmented-analytics
- https://www.geeksforgeeks.org/what-is-augmented-analytics-in-data-science/
- https://www.qlik.com/us/augmented-analytics
Cite this article:
Thanusri swetha J (2021), Augmented Analytics in Data Science, Anatechmaz, pp. 16
Recent Post
-
Augmented Analytics in Data Science
Augmented analytics is the use of enabling technologies such as machine learning and AI to assist...
-
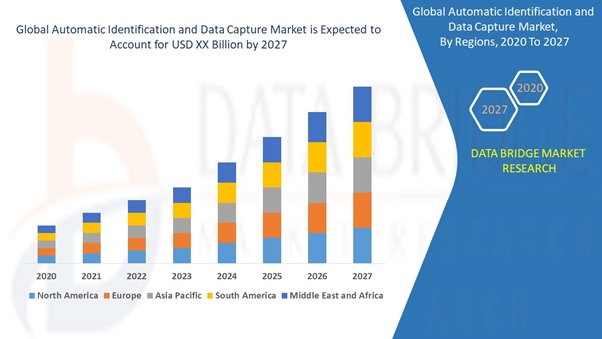
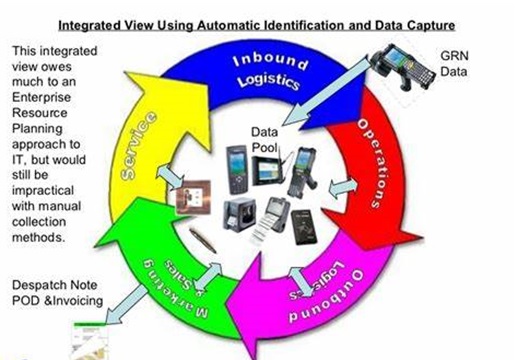
Automatic Identification and Data Capture (AIDC)
Data discovery has increased its impact in the last year. A survey conducted by the Business Application...
-
Automatic Identification of Data Collection
Automatic identification and data collection (also called AIDC, Auto ID, automatic data capture...
-
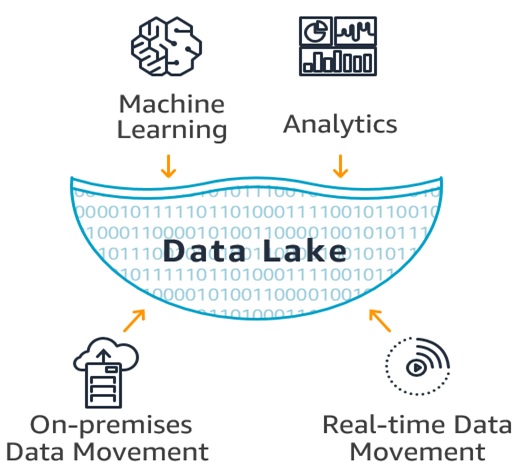
Characteristics of Data Lake
A data lake is a storage repository that holds a vast amount of raw data in its native format until it is needed for analytics...
-
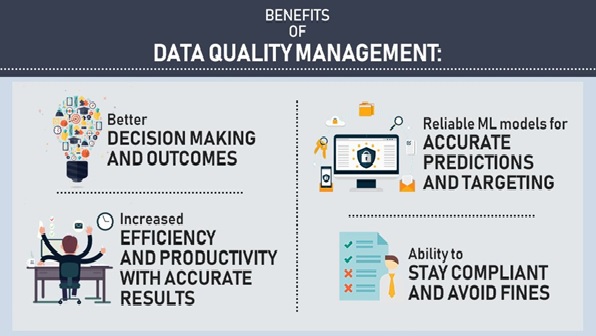
Data Quality Management (DQM)
Data is the driving force of every organization in the modern world. As organizations continue to collect more...
-
Embedded Analytics
When data analytics occurs within a user’s natural workflow, embedded analytics is the name of the game...
-

Graph Analytics in Data Science
Graph Data Science is a science-driven approach to gain knowledge from the relationships and structures in data...
-
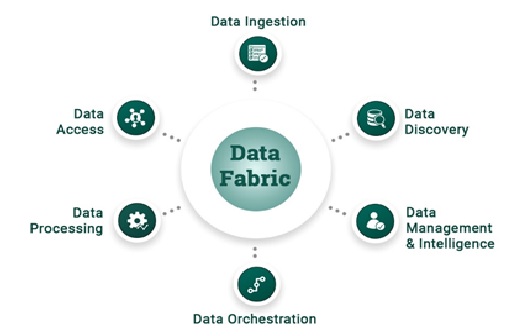
The Capabilities of Data Fabric
Gartner defines data fabric as a design concept that serves as an integrated layer (fabric) of data and connecting processes...
-
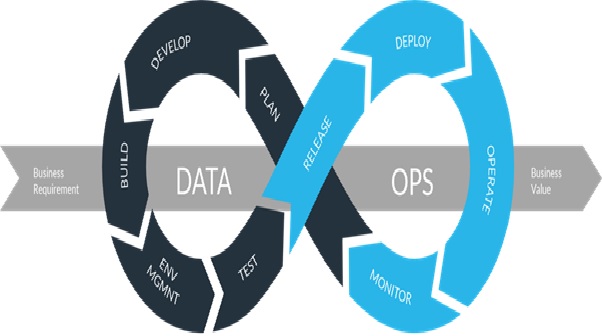
The Future of DataOps
DataOps (data operations) is an agile, process-oriented methodology for developing and delivering analytics...
-

The Future of Encryption
Data encryption is the process by which digital data is translated into a complex code using encryption algorithms...
-

The Real Time Data Analytics
Streaming data or real-time data is dynamic data that is continuously generated from a variety of sources like sensors...
-

Data Discovery/Visualization
Data discovery has increased its impact in the last year. A survey conducted by the Business Application Research Center...
-
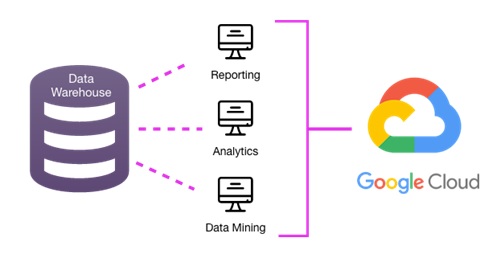
Benefits and Stages of Data Warehouse Modernization
Data warehousing is a technology that aggregates structured data from one or more sources...
-
Data Governance Tools (DG)
Data governance (DG) is the process of managing the availability, usability, integrity and security of the data in enterprise systems...
-
The Basic of Data Wrapper
Patterns and frameworks form an integral component of software engineering. A wrapper pattern is a class with a special interface...