
Tableau
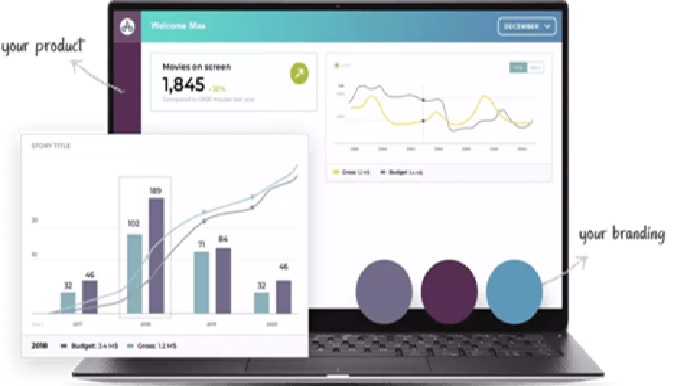
Tableau is a business intelligence and data visualization software that helps people see and understand their data. It allows users to connect, visualize, and share data in a way that is easy to understand and use.
Tableau has a user-friendly interface that allows users to drag and drop data, create visualizations, and share them with others. The software can connect to a wide variety of data sources, including spreadsheets, databases, and cloud services.
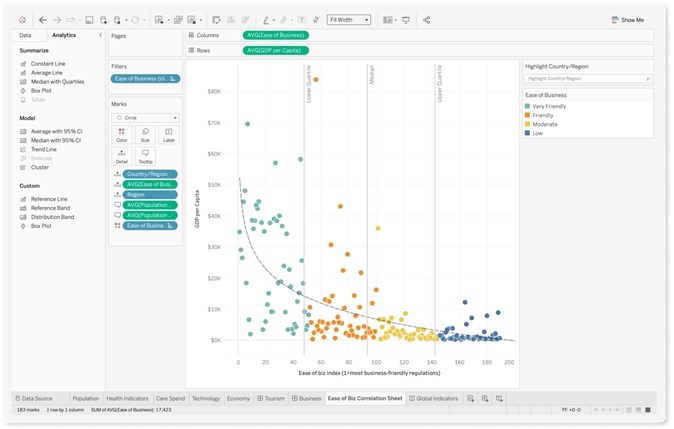
Figure 1. Tableau
Why Tableau is the most popular Data Visualization tool?
Tableau is used more frequently as the tool allows to analyze the data more quickly and visualizations are generated as dashboards and worksheets. Tableau enables us to make dashboards that give actionable insights and spreads the business faster. Tableau products are always operated in virtualized environments if they are configured with proper hardware and operating system. It is one of the best business intelligence and project management tools. There are plenty of reasons listed below that will tell you why businesses use Tableau as a Data Visualization tool:
- Great visualizations
- Detailed Insights
- User-friendly Approach
- Working with the different Data Sources
- Data set adding is easy
Some of the key features of Tableau include:
- Interactive Dashboards: Tableau allows users to create interactive dashboards that can be customized to meet specific business needs. Dashboards can include a variety of visualizations, such as charts, graphs, maps, and tables.
- Data Blending: Tableau can blend data from multiple sources to create a more complete picture of the data. This is particularly useful when working with data that is spread across different systems or departments.
- Data Preparation: Tableau offers a range of data preparation tools that allow users to clean, transform, and reshape their data before visualizing it. This helps to ensure that the data is accurate and relevant.
- Collaboration: Tableau allows users to share their dashboards and visualizations with others, either within the organization or with external stakeholders. This makes it easier to collaborate and make data-driven decisions.
Overall, Tableau is a powerful tool for businesses that need to make sense of large amounts of data. It allows users to quickly and easily visualize their data, identify trends and patterns, and make informed decisions based on the insights gained.
References:
- https://www.knowledgehut.com/blog/business-intelligence-and-visualization/why-tableau-is-so-popular
Cite this article:
Hana M (2023), Tableau, AnaTechMaz, pp.43
Recent Post
-

AI-Driven Robots to Restock Shelves in Stores Across Japan
Telexistence Inc. and FamilyMart Co. are rolling out a fleet of AI...
-

World’s First Ever Task Mining Playbook Launched
Everest Group, a leading research firm, announced the launch of the...
-

A New 3D Printed Shoe that Adapts to the Functional Design of the Foot
Berlin and Munich based design studio Wertel Oberfell’s ...
-

Data Integration
Data integration is the process of combining data from different sources, formats, and locations...
-
Data Quality Management (DQM)
These days, data is the livelihood of any business. Data helps a company predict...
-
Actionable Analytics Everywhere
Actionable analytics is one of the hottest analytics and business intelligence trends in 2020 ...
-

Mobile BI
Mobile BI, or mobile business intelligence, refers to the use of mobile devices such as...
-
Data Visualization
Data visualization software is a type of software tool that ...
-

Self-Service BI Interfaces
Self-service business intelligence has been ...
-
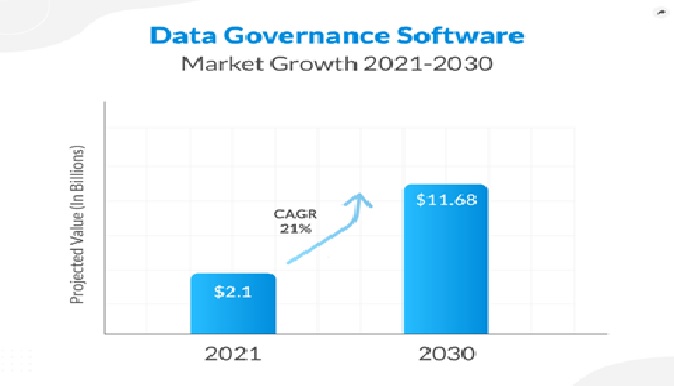
Data Governance Will Be a Primary Ask When Seeking BI Software
Among trends in business intelligence, assigning dedicated data roles like that of data ...
-
Data Governance Will Be a Primary Ask When Seeking BI Software
Data storytelling is among popular business intelligence trends as companies seek to...
-
Data Warehouse
A data warehouse is a centralized repository of data that is used for reporting and analysis...
-
Tableau
Tableau is a business intelligence and data visualization software that helps people see and ....
-

Data Automation
Data Automation is interpreted as handling, uploading, and processing data utilizing ...
-

Data governance
Before we define data governance, let us establish what we mean by “data.” In terms of IT, ...