
Methods Of Linear Regression
In statistics, linear regression is a linear approach for modelling the relationship between a scalar response and one or more explanatory variables (also known as dependent and independent variables). The case of one explanatory variable is called simple linear regression; for more than one, the process is called multiple linear regression.
Simple Linear Regression
Simple linear regression is the most straight forward case having a single scalar predictor variable x and a single scalar response variable y. The equation for this regression is given as y=a+bx.The expansion [1] to multiple and vector-valued predictor variables is known as multiple linear regression. It is also known as multivariable linear regression. The equation for this regression is given as Y = a+bX.Almost all real-world regression patterns include multiple predictors. The basic explanations of linear regression are often explained in terms of multiple regression. Note that, in these cases, the dependent variable y is yet a scalar.
The most popular method to fit a regression line in the XY plot is found by using least-squares. This process is used to determine the best-fitting line for the given data by reducing the sum of the squares of the vertical deviations from each data point to the line. If a point rests on the fitted line accurately, then the value of its perpendicular deviation is 0. It is 0 because the variations are first squared, then added, so their positive and negative values will not be cancelled.
Properties of Linear Regression
For the regression line where the regression parameters b00and b11are defined, the following properties are applicable:
- The regression line reduces the sum of squared differences between observed values and predicted values.
- The regression line passes through the mean of X and Y variable values.
- he regression constant b00 is equal to the y-intercept of the linear regression.
- The regression coefficient b11 is the slope of the regression line. Its value is equal to the average change in the dependent variable (Y) for a unit change in the independent variable (X)
Linear regression is an algorithm used to predict, or visualize, a relationship between two different features/variables. In linear regression tasks, there are two kinds of variables being examined: the dependent variable and the independent variable. The independent variable is the variable that stands by itself [2], not impacted by the other variable. As the independent variable is adjusted, the levels of the dependent variable will fluctuate. The dependent variable is the variable that is being studied, and it is what the regression model solves for/attempts to predict. In linear regression tasks, every observation/instance is comprised of both the dependent variable value and the independent variable value Figure 1 shown below.
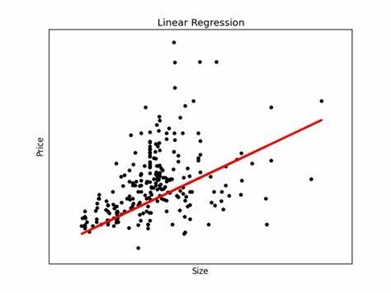
Figure 1. Linear Regression
Examples of linear regression:
- Prediction of Umbrella sold based on the Rain happened in Area.
- Prediction of AC sold based [3] on the Temperature in Summer.
- During the exam season, sales of Stationary basically, Exam guide sales increased.
- Prediction of sales when Advertising has done based on High TRP serial where an advertisement is done
References:
- https://www.vedantu.com/maths/linear-regression
- https://en.wikipedia.org/wiki/Linear_regression
- www.wallstreetmojo.com/linear-regression-examples
Cite this article:
S. Nandhinidwaraka (2021), Methods of Linear Regression, AnaTechMaz, pp. 13
Recent Post
-

Business and Consumer Application of Cloud Computing
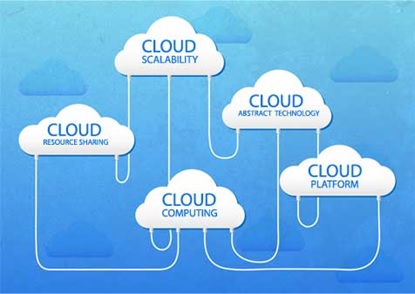
Cloud computing means storing and accessing data and programs over the Internet instead of your computer's hard drive.
-
Cloud Computing
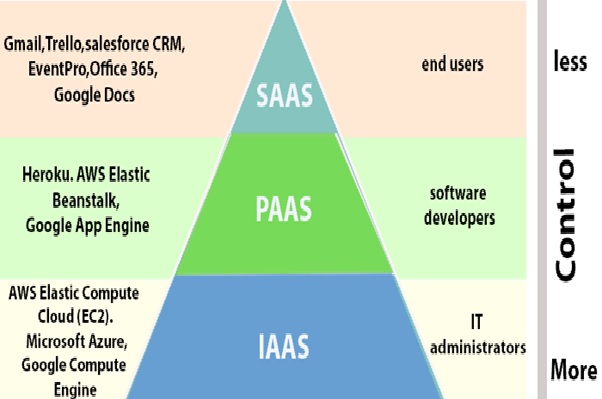
Cloud computing transforms IT infrastructure into a utility: It lets you ‘plug into' infrastructure via the internet, and use computing resources without installing and maintaining them on-premises.
-
Cloud Database
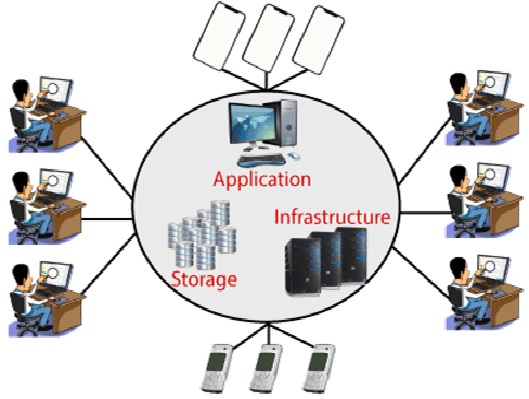
Cloud Computing is the delivery of computing services such as servers, storage, databases, networking, software, analytics, intelligence, and more, over the Cloud (Internet).
-
GitOps
GitOps upholds the principle that Git is the one and only source of truth.
-
Progressive Web Apps
The full form of PWA is Progressive Web Applications. PWA is HTML 5 webpage. It is a web...
-
The Development Cloud Load Balancing
Cloud load-balancing is the process of distributing workloads & computing resources...
-

The Development of Cloud Breaches in Covid19
Cloud-native breaches occur when an adversarial actor gains access...
-

Applications Of Mobile Cloud Computing
Mobile cloud computing uses cloud computing to deliver applications to mobile devices...
-

Essential Factors of Cloud Cryptography
Cloud computing is a framework for offering on-demand network access to a pooled pool...
-

Important Uses of Green Cloud Computing
Green cloud computing is a coined term that means making the practices and approaches...
-

Progressive Web Application Development Services
PWA is a website with all the benefits of an app. PWAs give you a faster, more reliable...
-

The Difference Between Remote Working and Video Conferencing
Remote working has become normalized as businesses realize the value that working...
-

Applications Of Cluster Analysis
Cluster analysis foundations rely on one of the most fundamental, simple and very often unnoticed ways (or methods) of understanding...
-
Cloud Scalability-Features and Uses
Cloud scalability in cloud computing refers to the ability to increase or decrease IT resources as needed...
-
Methods Of Linear Regression
In statistics, linear regression is a linear approach for modelling the relationship between a scalar response and one or more explanatory...