
The Big Data-Visualization
Big data visualization refers to the implementation of more contemporary visualization techniques to illustrate the relationships within data. Visualization tactics include applications that can display real-time changes [1] and more illustrative graphics, thus going beyond pie, bar and other charts. These illustrations veer figure 1 shown below away from the use of hundreds of rows, columns and attributes toward a more artistic visual representation of the data.
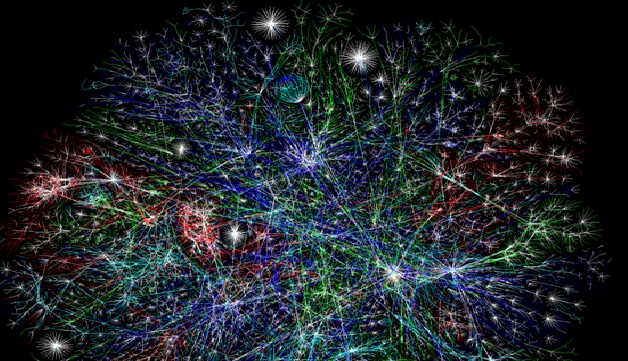
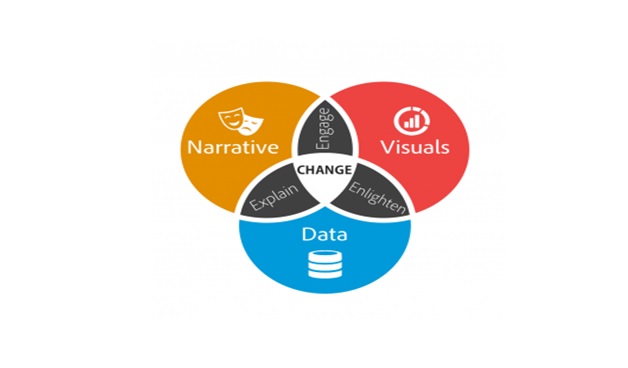
Figure1: Big Data Visulization
when businesses need to present relationships among data, they use graphs, bars and charts to do it. They can also make use of a variety of colors, terms and symbols. The main problem with this setup, however, is that it doesn't do a good job of presenting very large data or data that includes huge numbers. Data visualiztion uses more interactive, graphical illustrations - including personalization and animation - to display figures and establish connections among pieces of information.
Big data is an inexhaustible source of progress for business. Based on data insights, companies can improve their products, provide customers with more personalized services, increase performance, security, conversions, revenue and basically any business metrics that have growth potential.
Visualization and analytics play a pivotal role in leveraging big data. You see, as is big data can have little to no benefit for business. Often, it is represented by an enormous amount of unsorted and updating data in an unreadable form. Visualization and analytics are focused on turning big data into a comprehensible and practical source of high-value information for business.
Advantages of Big Data Visualization
- Facilitate perception and understanding. Human brain can process graphic information quickly and in much bigger portions than, for example, in spreadsheets or plain text. Visualization does exactly [2] what our brains need — creates graphic content based on the given data and enables easier perception and comprehension of a large amount of information.
- Recognize relationships and dependencies. Not only does the visualization of big data help in interpreting information. When placing data sets on one map or chart, for example, you can spot relationships and dependencies between them, identify specific conditions for certain events or results, etc. Thus, you can extract exclusive insights, which could have been unavailable if not for visual representation.
- Find patterns at scale and make predictions. Combined with advanced analytics, big data visualization help in a business case that requires finding patterns in data sets and, therefore, patterns in the events. Some of these patterns can be seen with a naked eye, for example, on a bubble plot (see below). Others can be recognized only by smart algorithms. Using patterns, executives can make predictions, identify trends and build a strategy based on real insights rather than assumptions.
- Provide real-time monitoring, control and immediate response. One of the biggest advantages of big data visualization is providing transparency and visibility of the processes in a company or organization. Depending on what data source we are talking about, executives can monitor in real-time the employees’ performance, a customer’s purchase journey or something as trivial as electricity consumption on the premises. These capabilities make better control over the processes possible and help take immediate action if needed.
- Determine errors, malfunctions, risks. This advantage vividly shows why data visualization is important, even indispensable. In some cases, visualized data can show errors, mistakes or even help measure risks. Monitoring the performance of connected heavy machinery, for example, can help determine errors before they lead to malfunction or breakdown. In terms of people’s safety, it relates to prevented accidents at the workplace and, in some cases, even saved lives.
References:
- https://www.techopedia.com/definition/28988/big-data-visualization#:~:text=Big%20data%20visualization%20refers%20to%20the%20implementation%20of, thus%20going%20beyond%20pie%2C%20bar%20and%20other%20charts.
- https://www.digiteum.com/data-visualization-your-business/
Cite this article:
Nandhinidwaraka. S (2021) The Big Data-Visualization,AnaTechMaz, pp. 33
Recent Post
-
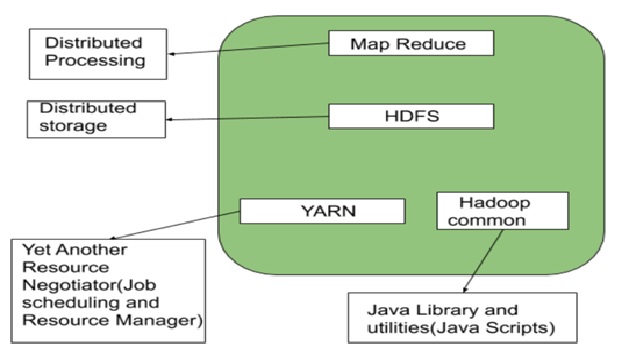
Overview of Hadoop Architecture
Apache Hadoop is an open source software framework used to develop data processing applications which are executed in a distributed ....
-
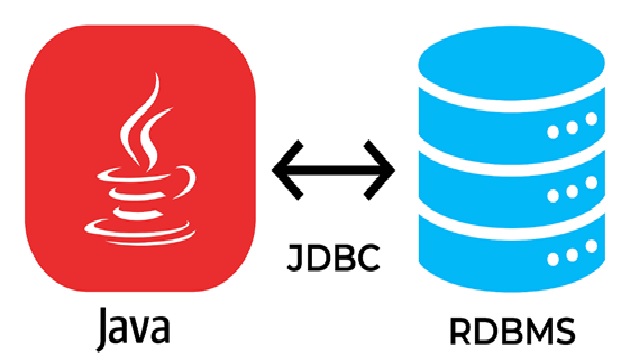
Overview of Java Database Connectivity
JDBC is an acronym for Java Database Connectivity. It’s an advancement for ODBC (Open Database ...
-
The Big Data-Visualization
Big data visualization refers to the implementation of more contemporary visualization techniques to illustrate the relationships within data....
-
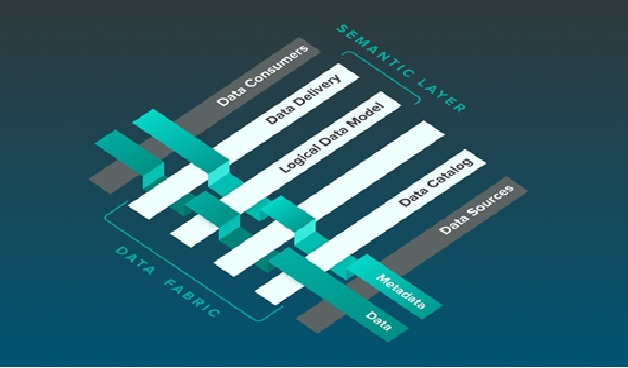
The Components of Data Fabrics
A data fabric is an architecture and set of data services that provide consistent capabilities across a choice of endpoints spanning....
-
The Future of Data Storytelling
Data storytelling is the best way to use data to create new knowledge and new decisions or actions. It is an integrative practice ....
-
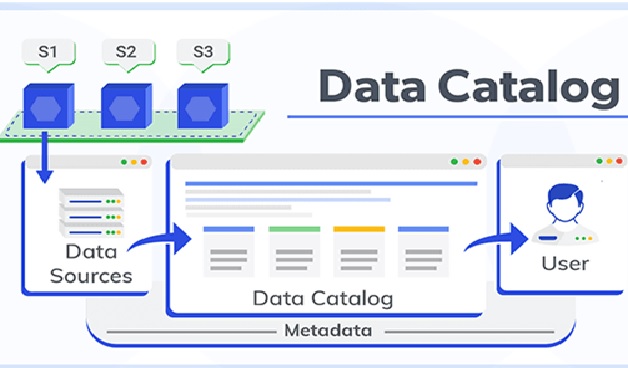
Types and Benefits of Data Cataloging
A data catalog is a detailed inventory of all data assets in an organization, designed to help data professionals ....
-

A New Software for Time Series Data Prediction
Making predictions using time-series data typically requires several data-processing steps and the...
-

Why Is Blockchain The Next Big Thing For Data Science?
Innovative technologies such as big data and blockchain are being hailed as the next .....
-

Data Automation
Business intelligence topics wouldn’t be complete without data (analysis) automation. In the last decade, we saw so much data....
-

Data Breach
A data breach is an incident wherein information is stolen or taken from a system without the.....
-
Data Cleaning Tools and benefits
Data cleaning is the crucial process of identifying and resolving broken, inaccurate, or unnecessary data. Data defects....
-

Data Modeling
Data modeling is the process of creating a visual representation of either a whole information system or parts of it to communicate ......
-

OCI Expands its Security to Safeguard Customers Data
Cloud major Oracle on Tuesday said it is expanding security services .....
-

ML Used to Predict the Age and Gender of Infant Using Temperature
A new study in PLOS ONE used machine learning to ....
-

India Replace Weather Balloons Sensors with Drones to Collect Atmospheric Data
India is set to deploy drones to gather atmospheric data that is .....