
Time-series Analysis
Time series analysis is a specific way of analyzing a sequence of data points collected over an interval of time. In time series analysis, analysts record data points at consistent intervals over a set period of time rather than just recording the data points intermittently or randomly. However, this type of analysis is not merely the act of collecting data over time.
Time Series Analysis Types:
- Classification
- Curve fitting
- Descriptive analysis
- Exploratory analysis
- Forecasting
- Intervention analysis
- Segmentation
Important Considerations for Time Series Analysis:
While time series data is data collected over time, there are different types of data that describe how and when that time data was recorded. For example:
- Time series data is data that is recorded over consistent intervals of time.
- Cross-sectional data consists of several variables recorded at the same time.
- Pooled data is a combination of both time series data and cross-sectional data.[1]
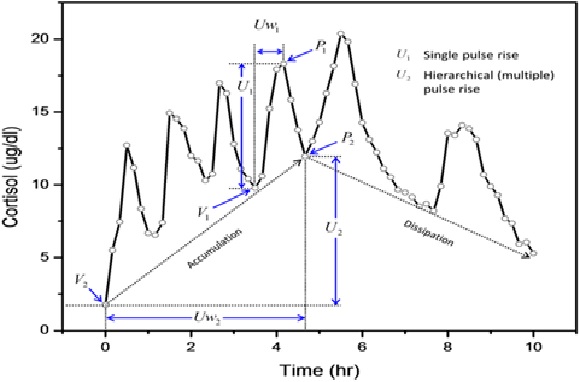
Figure 1. Time-series Analysis
Time-series Analysis is shown in figure 1. Time-series analysis is a statistical technique used to analyze and forecast time-dependent data. It is widely used in industries such as finance, healthcare, and manufacturing to predict future trends and make informed decisions.
Time series analysis methods:
Time series analysis is a method of analyzing a series of data points collected over a period of time. In time series analysis, data points are recorded at regular intervals over a set period of time, rather than intermittently or at random.
Time series analysis is the use of statistical methods to analyze time series data and extract meaningful statistics and characteristics about the data. TSA helps identify trends, cycles, and seasonal variances to aid in the forecasting of a future event. Factors relevant to TSA include stationarity, seasonality and autocorrelation.
Time series analysis can be useful to see how a given variable changes over time (while time itself, in time series data, is often the independent variable). Time series analysis can also be used to examine how the changes associated with the chosen data point compare to shifts in other variables over the same time period.
Learn more about time series analysis methods, including spectral analysis, wavelet analysis, autocorrelation, and cross-correlation.[2]
Time series analysis tries to understand changes in patterns over time. These patterns help to generate precise forecasts, such as future sales, GDP, and global temperatures.
One thing to remember is that the time series models incorporate the fact that time flows in one direction. Events closed together in time often have a stronger connection than more distant findings.
Like all data, time-series data contain random fluctuations. This randomness can obscure the underlying patterns. Smoothing techniques help to cancel out these fluctuations to clearly unveil the trends and cycles.[3]
References:
- https://www.automotiveworld.com/articles/integrated-mobility-can-fast-track-cities-to-cleaner-safer-streets
- https://www.mintsolutions.co.za/services/integrated-mobility-solution
- https://www.imobility.co.za/
Cite this article:
Gokula Nandhini K (2023), Integrated mobility solutions, AnaTechMaz, pp.132
Recent Post
-
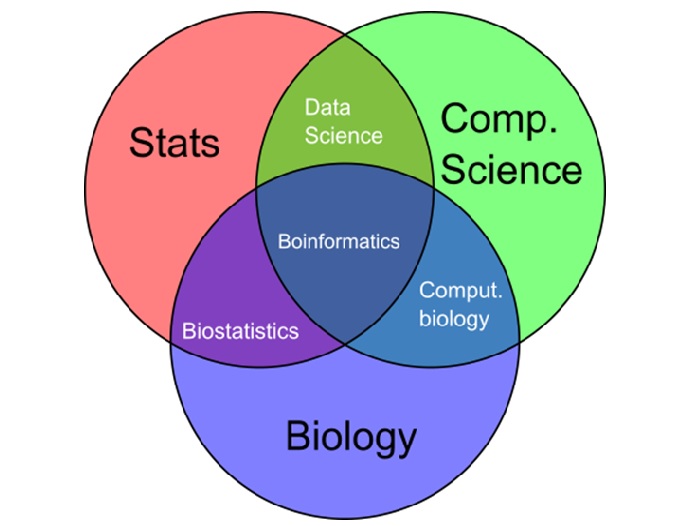
Bioinformatics
Bioinformatics is the application of computer science, mathematics, and statistics to biological data, particularly data related to DNA, RNA, and ......
-

Biopharmaceuticals
Biopharmaceuticals are drugs that are produced using biological processes, such as genetic engineering, recombinant DNA technology,.......
-
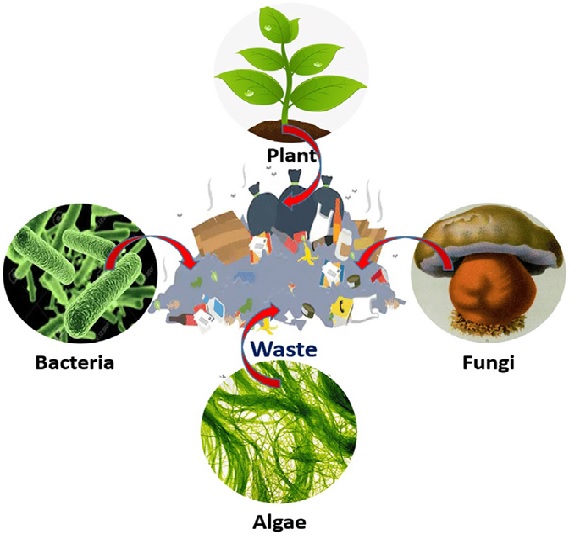
Bioremediation
Bioremediation is the process of using living organisms, usually bacteria or fungi, to remove or neutralize contaminants from the ......
-

Climate-Smart Agriculture
The development of farming practices that are resilient to the impacts of climate change, such as drought-resistant crops, soil..........
-
Conservation Agriculture
Reducing soil disturbance, maintaining soil cover, and rotating crops to improve soil health and resilience.Conservation Agriculture is a concept in ........
-

Digital Health
Digital health refers to the use of digital technologies, such as mobile devices, wearables, health apps, and telehealth, to improve healthcare delivery, ..........
-

Health Apps
Health apps are digital tools that can be downloaded and used on mobile devices or wearable technology to manage various aspects of health ........
-
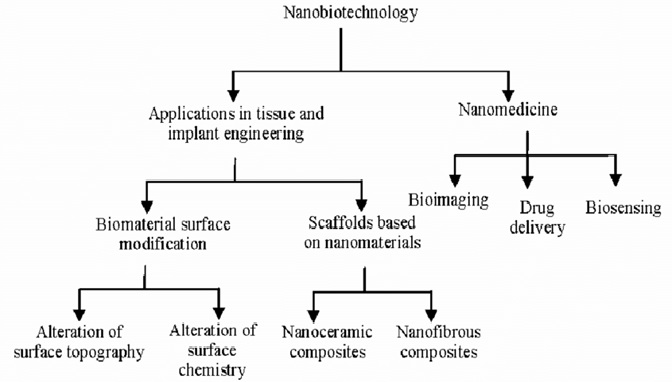
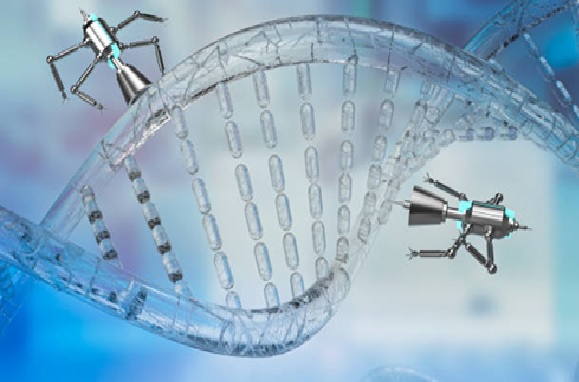
Nanobiotechnology
Nanobiotechnology is the application of nanotechnology to the field of biotechnology. It involves the use of nanoscale materials and ......
-
Nanomedicine
The use of nanoparticles and other nanoscale materials in medicine for drug delivery, imaging, and disease diagnosis Nanomedicine is a .......
-
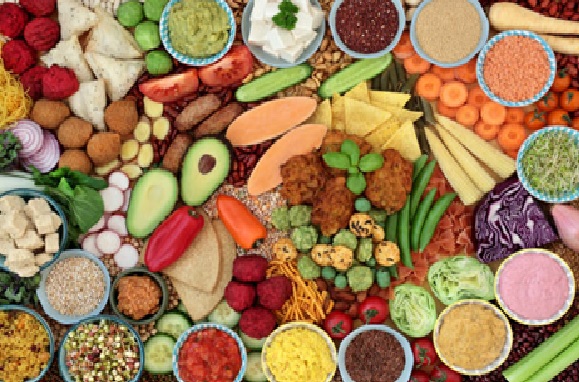
Plant-Based Meat Alternatives
The development of plant-based meat substitutes, which use technology to create products that look, taste, and feel like meat, but are made ....
-
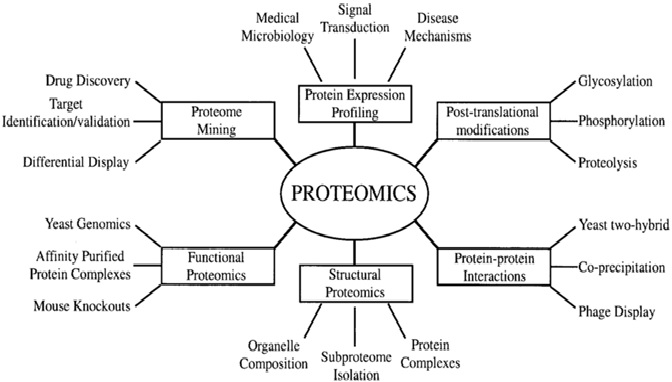
Proteomics
Proteomics is the study of the complete set of proteins expressed in a cell, tissue, or organism, and how these proteins interact with each .......
-
Time-series Analysis
Time series analysis is a specific way of analyzing a sequence of data points collected over an interval of time. In time series analysis,.........
-
Animal Microbiome Research
The study of the microbiomes of animals, including livestock and pets, and their impact on animal health, nutrition, and productivity.......
-
Farmer-Led Innovation
The promotion of farmer-led research and innovation, which involves the active participation of farmers in the design, implementation, and .......
-

Immunotherapy
, Immunotherapy is a type of cancer treatment that harnesses the power of the immune system to fight cancer. The immune system is the body's ....